Chasing leather
The List on players who have been witness to the most runs scored by the opposition over a career
Travis Basevi and George Binoy
26-May-2010
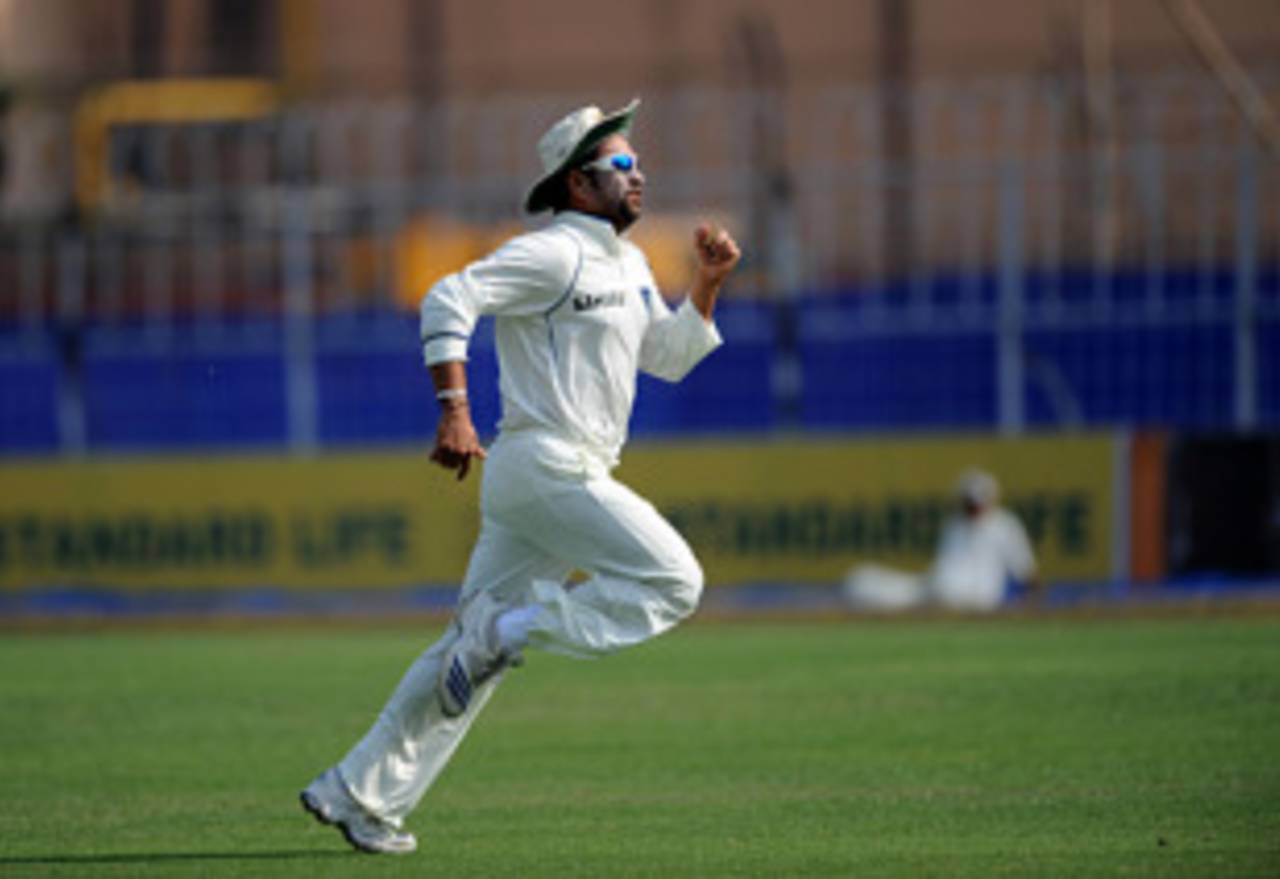
Sachin Tendulkar's made a lot of fielders chase, and done a lot of chasing himself over a 20-year career • AFP
Chasing leather. Everyone has to do it - some are ridiculously terrific at it, others incompetent - but most cricketers would prefer if they did less of it. We got asked, by a reader who called himself WW, for a List on players who have been witness to the most runs scored by the opposition over a career. No records exist, publicly at least, for time a player spent off the field during a match so no reductions have been made for runs scored during injury and bathroom breaks. We also looked at those players part of teams that conceded the highest average total per match, and had the highest average per wicket.
The table of players against whose teams opponents have scored the most runs is dominated by ones with the most Test caps. Sachin Tendulkar, who is two matches away from equalling Steve Waugh as the most-capped Test cricketer, has seen over 90,000 runs scored against India during his 20-year career, the most for any player. The average runs per match India conceded in his 166 Tests is 543.50; while the average runs per wicket is 35.42. Considering Tendulkar hasn't spent most of his career at slip, he's had plenty of ball chasing to do, and a lot of it in the sweltering heat of the subcontinent.
Australia conceded only 82,222 runs in Steve Waugh's 166 Tests, at an average of 490 per match and 29 per wicket - evidence of a vastly superior bowling attack compared to Tendulkar's India. Glenn McGrath's Australia averages - 467.41 per match and 25.80 per wicket - at the height of their dominance are even better.
| Player | Span | Mat | Runs | Balls | Wkts | R/M | R/6B | R/W |
|---|---|---|---|---|---|---|---|---|
| SR Tendulkar (India) | 1989-2010 | 166 | 90222 | 178715 | 2547 | 543.50 | 3.02 | 35.42 |
| SR Waugh (Aus) | 1985-2004 | 168 | 82227 | 172259 | 2843 | 489.44 | 2.86 | 28.92 |
| AR Border (Aus) | 1978-1994 | 156 | 77173 | 160942 | 2388 | 494.69 | 2.87 | 32.31 |
| R Dravid (ICC/India) | 1996-2010 | 139 | 77163 | 146662 | 2201 | 555.12 | 3.15 | 35.05 |
| RT Ponting (Aus) | 1995-2010 | 144 | 75884 | 147023 | 2620 | 526.97 | 3.09 | 28.96 |
| A Kumble (India) | 1990-2008 | 132 | 71661 | 142017 | 2070 | 542.88 | 3.02 | 34.61 |
| SK Warne (Aus) | 1992-2007 | 145 | 70592 | 145387 | 2582 | 486.84 | 2.91 | 27.34 |
| JH Kallis (ICC/SA) | 1995-2010 | 137 | 68970 | 135865 | 2297 | 503.43 | 3.04 | 30.02 |
| AJ Stewart (Eng) | 1990-2003 | 133 | 67055 | 130992 | 1921 | 504.17 | 3.07 | 34.90 |
| BC Lara (ICC/WI) | 1990-2006 | 131 | 66895 | 133702 | 1960 | 510.64 | 3.00 | 34.13 |
| MV Boucher (ICC/SA) | 1997-2010 | 131 | 66018 | 128312 | 2219 | 503.95 | 3.08 | 29.75 |
| S Chanderpaul (WI) | 1994-2009 | 123 | 64564 | 125187 | 1775 | 524.91 | 3.09 | 36.37 |
| N Kapil Dev (India) | 1978-1994 | 131 | 64322 | 138325 | 1792 | 491.00 | 2.79 | 35.89 |
| M Muralitharan (ICC/SL) | 1992-2009 | 132 | 63153 | 131131 | 2050 | 478.43 | 2.88 | 30.80 |
| SC Ganguly (India) | 1996-2008 | 113 | 62531 | 119943 | 1779 | 553.37 | 3.12 | 35.14 |
| VVS Laxman (India) | 1996-2010 | 110 | 62239 | 115446 | 1758 | 565.80 | 3.23 | 35.40 |
| Inzamam-ul-Haq (ICC/Pak) | 1992-2007 | 120 | 61423 | 116749 | 1918 | 511.85 | 3.15 | 32.02 |
| ME Waugh (Aus) | 1991-2002 | 128 | 61251 | 128104 | 2220 | 478.52 | 2.86 | 27.59 |
| SM Gavaskar (India) | 1971-1987 | 125 | 60972 | 132381 | 1718 | 487.77 | 2.76 | 35.49 |
| CA Walsh (WI) | 1984-2001 | 132 | 60609 | 129482 | 2134 | 459.15 | 2.80 | 28.40 |
| GD McGrath (Aus) | 1993-2007 | 124 | 57960 | 120051 | 2246 | 467.41 | 2.89 | 25.80 |
| MA Atherton (Eng) | 1989-2001 | 115 | 57769 | 113407 | 1644 | 502.33 | 3.05 | 35.13 |
| Javed Miandad (Pak) | 1976-1993 | 124 | 57698 | 124428 | 1877 | 465.30 | 2.78 | 30.73 |
| DI Gower (Eng) | 1978-1992 | 117 | 57517 | 120505 | 1686 | 491.59 | 2.86 | 34.11 |
| DB Vengsarkar (India) | 1976-1992 | 116 | 57142 | 122021 | 1589 | 492.60 | 2.80 | 35.96 |
West Indies conceded only 60,609 runs in Courtney Walsh's 132 Tests at an average of 459 per game - the lowest in the table above. The average runs per wicket taken - 28.40 - and economy-rate - 2.80 - are among the best as well. Walsh began his career in 1984 and for several years was the third or fourth cog in an attack boasting Joel Garner, Michael Holding, and Malcolm Marshall among others. Then came Curtly Ambrose and Ian Bishop and, with Walsh, they forged a potent pace attack through the 1990s. Once Ambrose retired, though, the average runs West Indies conceded per Test rose sharply. It was 507 in Walsh's last ten Tests without Ambrose and the average per wicket was 33.
The player whose team has conceded the most runs per Test on average is Pakistan's Salman Butt, and he's contributed next to nothing in comparison. Pakistan's opponents have scored an average of 626.14 runs in Butt's 27 matches at a run-rate of 3.66, which is also the highest conceded by a team in a player's career. It's perhaps an indictment on how flat Pakistan's pitches have been in recent times. The only other player who's had an average of over 600 runs conceded per match is incidentally another opener - West Indian Devon Smith.
| Player | Span | Mat | Runs | Balls | Wkts | R/M | R/6B | R/W |
|---|---|---|---|---|---|---|---|---|
| Salman Butt (Pak) | 2003-2010 | 27 | 16906 | 27683 | 400 | 626.14 | 3.66 | 42.26 |
| DS Smith (WI) | 2003-2009 | 31 | 18730 | 31099 | 428 | 604.19 | 3.61 | 43.76 |
| NWD Yardley (Eng) | 1938-1950 | 20 | 11976 | 26653 | 280 | 598.80 | 2.69 | 42.77 |
| IK Pathan (India) | 2003-2008 | 29 | 17266 | 30536 | 488 | 595.37 | 3.39 | 35.38 |
| Yuvraj Singh (India) | 2003-2010 | 33 | 19602 | 35001 | 566 | 594.00 | 3.36 | 34.63 |
| DJ Bravo (WI) | 2004-2009 | 34 | 20192 | 34817 | 454 | 593.88 | 3.47 | 44.47 |
| BJ Haddin (Aus) | 2008-2010 | 27 | 15942 | 29184 | 480 | 590.44 | 3.27 | 33.21 |
| CD Collymore (WI) | 1999-2007 | 30 | 17704 | 31281 | 431 | 590.13 | 3.39 | 41.07 |
| Yasir Hameed (Pak) | 2003-2007 | 23 | 13556 | 24311 | 379 | 589.39 | 3.34 | 35.76 |
| MG Johnson (Aus) | 2007-2010 | 34 | 20003 | 36608 | 607 | 588.32 | 3.27 | 32.95 |
| Mohammad Sami (Pak) | 2001-2010 | 34 | 19970 | 34178 | 515 | 587.35 | 3.50 | 38.77 |
| Kamran Akmal (Pak) | 2002-2010 | 48 | 28067 | 47989 | 734 | 584.72 | 3.50 | 38.23 |
| GO Jones (Eng) | 2004-2006 | 34 | 19808 | 34850 | 589 | 582.58 | 3.41 | 33.62 |
| JA Rudolph (SA) | 2003-2006 | 35 | 20290 | 36880 | 554 | 579.71 | 3.30 | 36.62 |
| Faisal Iqbal (Pak) | 2001-2010 | 26 | 15029 | 25475 | 366 | 578.03 | 3.53 | 41.06 |
| MS Dhoni (India) | 2005-2010 | 43 | 24774 | 45204 | 704 | 576.13 | 3.28 | 35.19 |
| AB Agarkar (India) | 1998-2006 | 26 | 14964 | 26664 | 373 | 575.53 | 3.36 | 40.11 |
| Umar Gul (Pak) | 2003-2010 | 26 | 14899 | 26580 | 424 | 573.03 | 3.36 | 35.13 |
| JE Taylor (WI) | 2003-2009 | 29 | 16557 | 29079 | 388 | 570.93 | 3.41 | 42.67 |
| W Jaffer (India) | 2000-2008 | 31 | 17693 | 32860 | 504 | 570.74 | 3.23 | 35.10 |
| D Ganga (WI) | 1998-2008 | 48 | 27391 | 49602 | 642 | 570.64 | 3.31 | 42.66 |
| JW Gleeson (Aus) | 1967-1972 | 29 | 16541 | 39423 | 491 | 570.37 | 2.51 | 33.68 |
| V Sehwag (ICC/India) | 2001-2010 | 76 | 43171 | 78877 | 1210 | 568.03 | 3.28 | 35.67 |
| JM Anderson (Eng) | 2003-2010 | 46 | 26060 | 46318 | 722 | 566.52 | 3.37 | 36.09 |
| D Ramdin (WI) | 2005-2009 | 39 | 22088 | 37881 | 512 | 566.35 | 3.49 | 43.14 |
While most of the players in the table above are from the 21st century, there is one surprising entry from the 1940s. Norman Yardley played 20 Tests for England between 1938 and 1950 and watched the opposition scored nearly 599 runs per match on average.
The only players who've had to endure an average of over 50 runs for a wicket to fall in their Test careers are from Bangladesh - Javed Omar (54.64), Khaled Mashud (52.59), Habibul Bashar (51.95) and Tapash Baisya (50.69).
In ODIs, it's Tendulkar once again who has seen most runs scored by the opposition - 96,976 in 442 matches at an average of 219 per game and 31 per wicket. Those figures are lower for the only other 400-ODI veteran Sanath Jayasuriya. Sri Lanka conceded a total of 92,560 in Jayasuriya's 444 ODIs, and around 208 per match.
| Player | Span | Mat | Runs | Balls | Wkts | R/M | R/6B | R/W |
|---|---|---|---|---|---|---|---|---|
| SR Tendulkar (India) | 1989-2010 | 442 | 96976 | 118009 | 3121 | 219.40 | 4.93 | 31.07 |
| ST Jayasuriya (Asia/SL) | 1989-2009 | 444 | 92560 | 118506 | 3200 | 208.46 | 4.68 | 28.92 |
| Inzamam-ul-Haq (Asia/Pak) | 1991-2007 | 378 | 77890 | 100376 | 2812 | 206.05 | 4.65 | 27.69 |
| R Dravid (Asia/ICC/India) | 1996-2009 | 339 | 76012 | 91178 | 2417 | 224.22 | 5.00 | 31.44 |
| RT Ponting (Aus/ICC) | 1995-2010 | 345 | 72031 | 91976 | 2814 | 208.78 | 4.69 | 25.59 |
| Wasim Akram (Pak) | 1984-2003 | 356 | 70312 | 93398 | 2625 | 197.50 | 4.51 | 26.78 |
| SC Ganguly (Asia/India) | 1992-2007 | 311 | 69506 | 83185 | 2202 | 223.49 | 5.01 | 31.56 |
| M Muralitharan (Asia/ICC/SL) | 1993-2009 | 334 | 69388 | 90267 | 2549 | 207.74 | 4.61 | 27.22 |
| M Azharuddin (India) | 1985-2000 | 334 | 69301 | 89721 | 2328 | 207.48 | 4.63 | 29.76 |
| WPUJC Vaas (Asia/SL) | 1994-2008 | 322 | 67127 | 86352 | 2350 | 208.46 | 4.66 | 28.56 |
| SR Waugh (Aus) | 1986-2002 | 325 | 67126 | 90570 | 2486 | 206.54 | 4.44 | 27.00 |
| DPMD Jayawardene (Asia/SL) | 1998-2010 | 317 | 66388 | 84337 | 2392 | 209.42 | 4.72 | 27.75 |
| PA de Silva (SL) | 1984-2003 | 308 | 64790 | 82344 | 2055 | 210.35 | 4.72 | 31.52 |
| SM Pollock (Afr/ICC/SA) | 1996-2008 | 303 | 62975 | 82152 | 2352 | 207.83 | 4.59 | 26.77 |
| Shahid Afridi (Asia/ICC/Pak) | 1996-2010 | 293 | 62898 | 78347 | 2277 | 214.66 | 4.81 | 27.62 |
| JH Kallis (Afr/ICC/SA) | 1996-2010 | 299 | 61956 | 79995 | 2310 | 207.21 | 4.64 | 26.82 |
| BC Lara (ICC/WI) | 1990-2007 | 299 | 61505 | 79764 | 2044 | 205.70 | 4.62 | 30.09 |
| MV Boucher (Afr/SA) | 1998-2010 | 291 | 61205 | 77871 | 2233 | 210.32 | 4.71 | 27.40 |
| Mohammad Yousuf (Asia/Pak) | 1998-2010 | 282 | 61045 | 75158 | 2177 | 216.47 | 4.87 | 28.04 |
| AC Gilchrist (Aus/ICC) | 1996-2008 | 287 | 60341 | 77492 | 2326 | 210.24 | 4.67 | 25.94 |
| SP Fleming (ICC/NZ) | 1994-2007 | 280 | 59691 | 74929 | 1943 | 213.18 | 4.77 | 30.72 |
| A Kumble (Asia/India) | 1990-2007 | 271 | 59417 | 73333 | 1931 | 219.25 | 4.86 | 30.77 |
| A Ranatunga (SL) | 1982-1999 | 269 | 57534 | 72233 | 1758 | 213.88 | 4.77 | 32.72 |
| Yuvraj Singh (Asia/India) | 2000-2010 | 250 | 57014 | 66518 | 1817 | 228.05 | 5.14 | 31.37 |
| MS Atapattu (SL) | 1990-2007 | 268 | 56853 | 72951 | 1979 | 212.13 | 4.67 | 28.72 |
India allrounder Ravindra Jadeja is only 21 years old but he's rapidly accumulating experience of playing in high-scoring one-day internationals on flat tracks. India's conceded an average of nearly 270 runs per match in Jadeja's 22 ODIs at a run-rate of nearly 5.8 - both of which are highest average figures for a player's team over a career. India's taken a wicket every 39 runs on average in these matches.
| Player | Span | Mat | Runs | Balls | Wkts | R/M | R/6B | R/W |
|---|---|---|---|---|---|---|---|---|
| RA Jadeja (India) | 2009-2010 | 22 | 5927 | 6147 | 152 | 269.40 | 5.78 | 38.99 |
| M Kartik (India) | 2002-2007 | 37 | 9384 | 10246 | 257 | 253.62 | 5.49 | 36.51 |
| L Balaji (India) | 2002-2009 | 30 | 7544 | 8021 | 216 | 251.46 | 5.64 | 34.92 |
| LE Plunkett (Eng) | 2005-2010 | 28 | 6965 | 7682 | 198 | 248.75 | 5.43 | 35.17 |
| V Kohli (India) | 2008-2010 | 23 | 5721 | 6309 | 170 | 248.73 | 5.44 | 33.65 |
| AN Cook (Eng) | 2006-2010 | 26 | 6333 | 7099 | 186 | 243.57 | 5.35 | 34.04 |
| AA Mulla (Can) | 2006-2009 | 24 | 5844 | 6553 | 144 | 243.50 | 5.35 | 40.58 |
| TT Bresnan (Eng) | 2006-2010 | 21 | 5098 | 5702 | 154 | 242.76 | 5.36 | 33.10 |
| HK Badani (India) | 2000-2004 | 40 | 9683 | 11280 | 295 | 242.07 | 5.15 | 32.82 |
| Sohail Tanvir (Pak) | 2007-2009 | 31 | 7487 | 8760 | 249 | 241.51 | 5.12 | 30.06 |
| PP Chawla (India) | 2007-2008 | 21 | 5042 | 5798 | 146 | 240.09 | 5.21 | 34.53 |
| SK Raina (India) | 2005-2010 | 90 | 21472 | 24336 | 675 | 238.57 | 5.29 | 31.81 |
| Salman Butt (Pak) | 2004-2010 | 76 | 18128 | 20948 | 566 | 238.52 | 5.19 | 32.02 |
| S Sreesanth (India) | 2005-2010 | 49 | 11661 | 13003 | 351 | 237.97 | 5.38 | 33.22 |
| SHT Kandamby (SL) | 2004-2010 | 31 | 7361 | 8201 | 217 | 237.45 | 5.38 | 33.92 |
| P Kumar (India) | 2007-2010 | 36 | 8530 | 9453 | 265 | 236.94 | 5.41 | 32.18 |
| Shahriar Hossain (Ban) | 1997-2004 | 20 | 4731 | 5380 | 110 | 236.55 | 5.27 | 43.00 |
| RR Powar (India) | 2004-2007 | 31 | 7332 | 8509 | 225 | 236.51 | 5.17 | 32.58 |
| HMCM Bandara (SL) | 2006-2010 | 31 | 7314 | 8479 | 225 | 235.93 | 5.17 | 32.50 |
| RN Lewis (WI) | 1997-2009 | 28 | 6601 | 7892 | 213 | 235.75 | 5.01 | 30.99 |
| YK Pathan (India) | 2008-2010 | 33 | 7767 | 8151 | 235 | 235.36 | 5.71 | 33.05 |
| BA Murphy (Zim) | 2000-2003 | 31 | 7296 | 8482 | 200 | 235.35 | 5.16 | 36.48 |
| M Mbangwa (Zim) | 1996-2002 | 29 | 6822 | 8028 | 190 | 235.24 | 5.09 | 35.90 |
| TBM de Leede (Neth) | 1996-2007 | 29 | 6792 | 7254 | 190 | 234.20 | 5.61 | 35.74 |
| AD Mascarenhas (Eng) | 2007-2009 | 20 | 4682 | 5211 | 149 | 234.10 | 5.39 | 31.42 |
If there's a particular List you would like to see, email us with your comments and suggestions.
George Binoy is a senior sub-editor at Cricinfo